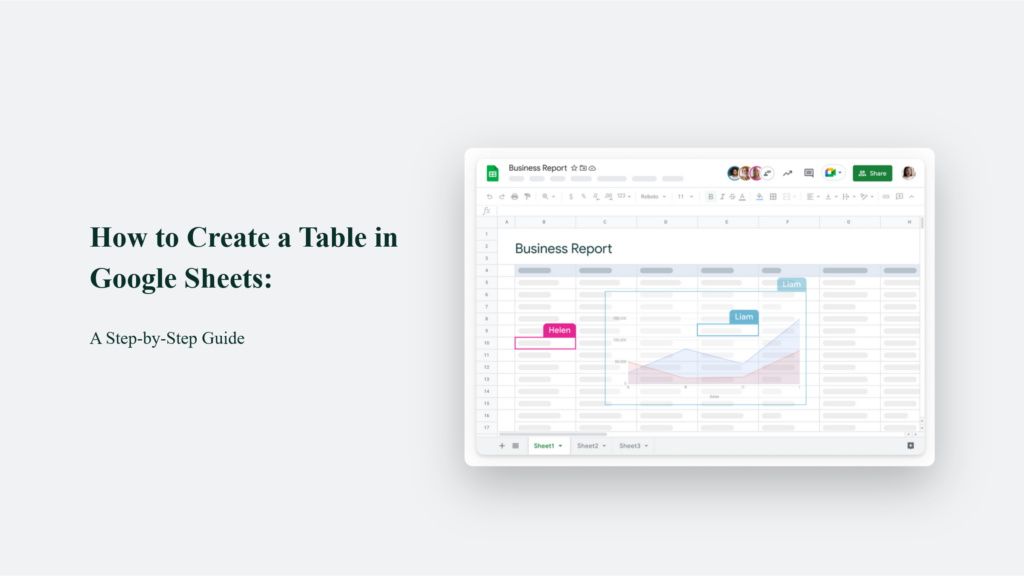

How to Create a Table in Google Sheets: A Step-by-Step Guide

As Seen On
Google Sheets is a powerful tool for organizing, analyzing, and visualizing data effectively. One of its most essential features is the ability to create tables. Whether you’re a student, professional, or just someone looking to keep track of important information, knowing how to create a table in Google Sheets is valuable.
In this article, we’ll explore the step-by-step process of creating tables in Google Sheets and provide tips and tricks for making your tables stand out.

Why Use Tables in Google Sheets?
Tables are incredibly useful for organising and analysing data in Google Sheets. Here are some key benefits of using tables:
- Improved Readability: Tables make your data much easier to read and understand at a glance. You can quickly scan and comprehend the information by formatting your data as a table with clear headers, consistent styling, and defined boundaries.
- Easier Data Analysis: Tables enable you to use powerful features like sorting, filtering, and conditional formatting with just a few clicks. This allows you to quickly slice and dice your data to uncover insights and patterns that may not be immediately obvious in raw data.
- Reduced Errors: When you reference data in a table, those references will automatically adjust if you add or remove rows. This helps avoid broken formulas and makes your analysis more robust.
- Enhanced Collaboration: Tables make sharing a specific data set with colleagues and collaborating on analysis is simple. Others can easily edit data, add comments, or build on your work.
How to Create a Table in Google Sheets: A Step-by-Step Guide
Step 1: Open a New or Existing Google Sheets Document
To get started, open a new or existing Google Sheets document. If you’re starting from scratch, simply go to Google Sheets and click on the “Blank” template to open a new one.
Step 2: Enter Your Data
Next, enter your data into the spreadsheet. Each row should represent a single record, while each column should represent a specific attribute or category.
For example, if you’re creating a table of employee information in google spreadsheet, you might have columns for “Name,” “Department,” “Position,” and “Salary.”
Tips for Entering Data
- Be consistent with your formatting. If you’re using dates, ensure they’re all in the same format (e.g., MM/DD/YYYY).
- Use clear and concise headers for each column to make your data easy to understand.
- Double-check your data for accuracy before moving on to the next step.
Step 3: Select Your Data
Once you’ve entered your data, it’s time to select the range of cells you want to include in your table. To do this, click and drag your mouse over the desired cells or use the keyboard shortcut Ctrl + A (Windows) or Command + A (Mac) to select the entire sheet.
Step 4: Create Your Table
With your data selected, it’s time to create your table.
Here’s how:
- Click on the “Format” menu in the toolbar.
- Select “Table” from the dropdown menu.
- Choose a table style from the options provided, or create your own custom style.
Alternatively, you can quickly create a table by pressing Ctrl + Alt + T (Windows) or Command + Option + T (Mac).
Update – New Way to Create Tables (May 2024)
Step 5: Formatting Your Table
- Select the entire data range, including the header row.
- Go to the “Format” menu, hover over “Alternating colors”, and choose a color scheme. This will give your table a professional, striped appearance that makes rows easier to distinguish.
- Select just the header row, click the “B” button to make the text bold, and use the alignment buttons to centre the text. This helps the headers stand out from the data.
- Adjust column widths by dragging the dividers between column headers so the data fits well and is easy to read.
- Customize fonts, text sizes, colors, and cell borders using options under the “Format” menu to further style your table and highlight important data.
Step 6: Adding Filtering
- Select the header row of your table.
- Go to the “Data” menu and click “Create a filter”.
- Filter buttons will appear in each header cell, allowing you to filter and sort your table by any column easily.
Making Your Table More Functional
Beyond basic formatting, there are several ways to make your table more functional and user-friendly:
Filtering and Sorting
Click on the “Filter” button in the toolbar to add filters to your table and quickly sort and analyze your data. It allows users to filter data by column values.
Collapsible Rows and Columns
If you’re dealing with a large table, you can make rows or columns collapsible. To do this, select the rows or columns you want to group, right-click, and choose “Group rows/columns.”
It allows users to expand and collapse sections of the table as needed.
Named Ranges for Searchability
If you frequently refer to data in your tables from other tables or formulas, using named ranges can save you a lot of time. Select the table range, go to “Data” > “Named ranges,” and give your table a name.
You can then reference the table or specific columns using the named range in formulas, making your data more searchable and accessible.
Automating Google Sheets
Automating tasks in Google Sheets provides several key benefits:
- Saves Time: Automating repetitive tasks like data entry, report generation, and updates frees up significant time to focus on higher-value work.
- Reduces Errors: Automated processes are much less prone to human errors that can occur with manual data entry and updates. This improves data accuracy and consistency.
- Enables Real-Time Collaboration: Automations can provide team members instant access to current data, enhancing collaboration and alignment.
Top Methods to Automate Google Sheets
There are several powerful ways to automate tasks in Google Sheets:
Macros
Macros allow you to record a series of actions in Google Sheets and then re-run those actions with a single click. This feature is useful for automating formatting, data entry, and multi-step processes.
To record a macro:
- Go to Tools > Macros > Record macro
- Perform the actions you want to automate
- Click Save to name and save your macro
- To run the macro later, go to Tools > Macros and click your macro name
Google Sheets Add-Ons
Google Sheets has a variety of add-ons that provide automation capabilities without requiring coding knowledge. Some top automation add-ons include:
- Sheet Automation: Allows you to create automated workflows based on triggers and conditions to move data, send notifications, format cells, and more.
- Coefficient: Enables importing data from sources like CRMs, databases, and analytics tools to automate data syncing and reporting.
- Zapier: Connects Google Sheets with thousands of apps to automate workflows between them, such as automatically adding form entries to sheets.
Apps Script
You can use Apps Script, Google’s scripting language for more advanced and custom automation to write custom functions and automate tasks. Some common automation with Apps Script include:
- Automatically sending emails
- Generating custom reports and dashboards
- Integrating with external APIs
- Running processes on a schedule
To get started with Apps Script:
- In Google Sheets, go to Extensions > Apps Script
- Click the ‘+’ to create a new script
- Write your automation script using JavaScript
- Save and run your script to automate your task
Examples of Google Sheets Automations
Here are a few examples of useful automations you can set up in Google Sheets:
- Automatically format new form response data
- Send an alert when a metric drops below a threshold
- Sync customer data from your CRM every night
- Email a report to stakeholders on a weekly schedule
- Move rows to another sheet when a status is updated
Conclusion
Creating tables in Google Sheets is straightforward and can greatly enhance your ability to organize, analyze data management well, and present data effectively.
Following the steps outlined in this guide and experimenting with various other formatting options and functional options, you can create professional-looking, user-friendly tables that meet your needs.
As you become more comfortable with tables in Google Sheets, you’ll find countless ways to leverage this powerful feature to streamline your workflow and make better data-driven decisions.
Frequently Asked Questions:
Can I convert an existing range of cells into a table?
Yes! Simply select the range of cells multiple tables you want to convert and follow the steps outlined in this article to create a table.
How do I add or remove columns from my table?
To add a column, simply select a cell to the right of your table and start typing. To remove a column, right-click on the column header and select “Delete Column.”
Can I sort my table by multiple columns?
Yes! To sort by multiple columns, click on the “Data” menu in the toolbar and select “Sort Range.” From there, you can choose how many rows which columns to sort by and in what order.
Konger
Up until working with Casey, we had only had poor to mediocre experiences outsourcing work to agencies. Casey & the team at CJ&CO are the exception to the rule.
Communication was beyond great, his understanding of our vision was phenomenal, and instead of needing babysitting like the other agencies we worked with, he was not only completely dependable but also gave us sound suggestions on how to get better results, at the risk of us not needing him for the initial job we requested (absolute gem).
This has truly been the first time we worked with someone outside of our business that quickly grasped our vision, and that I could completely forget about and would still deliver above expectations.
I honestly can't wait to work in many more projects together!
Disclaimer
*The information this blog provides is for general informational purposes only and is not intended as financial or professional advice. The information may not reflect current developments and may be changed or updated without notice. Any opinions expressed on this blog are the author’s own and do not necessarily reflect the views of the author’s employer or any other organization. You should not act or rely on any information contained in this blog without first seeking the advice of a professional. No representation or warranty, express or implied, is made as to the accuracy or completeness of the information contained in this blog. The author and affiliated parties assume no liability for any errors or omissions.

